We have created classes to enable you to use the functionality of the SGT with minimal effort. This section details how to set up your terminal to use these "helper" classes, which call methods in the SGT classes.
You must instruct your program where to find both our helper classes and the SGT classes. This requires you to do two things:
(a) If you use the bash shell (echo $SHELL at the command prompt will tell you your shell type, in most cases it will be bash) edit your .bashrc file in your home directory to contain the following line :
export CLASSPATH=/usr/local/j2sdk1.4.0_01/:/usr/phys.local/java/classes/sgt_cplab.jar:.
and dont forget the final :.
If you use the csh/tcsh, edit your .cshrc file in your home directory to contain the following line:
setenv CLASSPATH /usr/local/j2sdk1.4.0_01/:/usr/phys.local/java/sgt_cplab.jar:.
and dont forget the final :.
This is something that you must do ONCE and ONLY ONCE. This file will be ready every time you start a session on the cplab machines and will tell your session where to find the helper classes
(b) The second thing you must do is for EVERY java program you write; the first line, after comments, must contain the command
import gov.noaa.pmel.sgt.cplab.*;
This line imports the CPLab classes that have been included in SGT to ease the developement of your application.
You are now ready to create a simple graph using these
classes.
This section takes you through creating a simple y = x^2 curve.
First of all, as with all Java applications, you need to declare your class as normal and create a main method:
public class your_class {

    public static void main(String[] args) {

        //...

    }

    //...
    }
Now create an instance of SimpleGraph and call it sg:
	SimpleGraph sg = new SimpleGraph("X v. Y Demo",
					 "x", "y");
Note: the above code goes in the main
method.
Now create a DataSet that you will add points to later:
DataSet ds = new DataSet();
You now need to generate the x and y data each and add it to the DataSet, ds:
	for (int i = 0; i <= 100; i++) {
	    ds.addPoint(i, i*i);
	}
Colour
You can set the colour of the graph to be plotted with the following, but you will need to have the line
import java.awt.*
at the top of your file (above any class declarations)
ds.setColor(Color.red);
To finish the program off and display the graph you need to add the DataSet, ds, to the SimpleGraph, sg, and call the method showGraph():
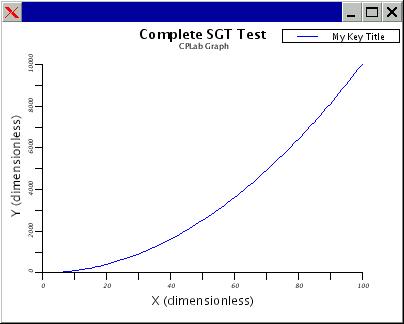
	//add the DataSet to the SimpleGraph
	sg.addData(ds, "My Key Title");

	//make the graph visible
	sg.showGraph();
You can then compile and run this application as normal. The complete source of this demonstration looks like this (you can download it here):
import gov.noaa.pmel.sgt.cplab.SimpleGraph;

public class xy_withoutarrays {

    public static void main(String[] args) {

	SimpleGraph sg = new SimpleGraph("X v. Y Demo", "x", "y");

	DataSet ds = new DataSet();

	for (int i = 0; i <= 100; i++) {
	    ds.addPoint(i, i*i);
	}

	//add the DataSet to the SimpleGraph
	sg.addData(ds, "My Key Title");

	//make the graph visible
	sg.showGraph();

    }

}
This is how the above example should look:
You can attach further DataSets even after the graph is visible
with sg.addData(your_DataSet);
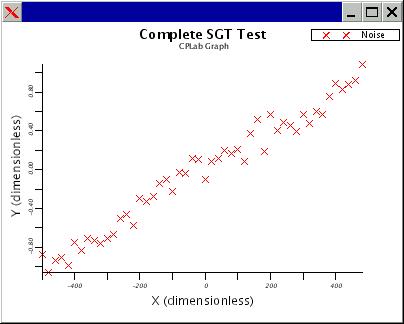
If you want to plot the points in your dataset without drawing lines connecting them, you can construct the DataSet as follows:
DataSet ds = new PointDataSet();
You then treat ds as we did in the example above. The constructor constructs a DataSet and presets the line style to MARK. To find out more about setting the line style, see the next section.
Here is an example of a PointDataSet plot:
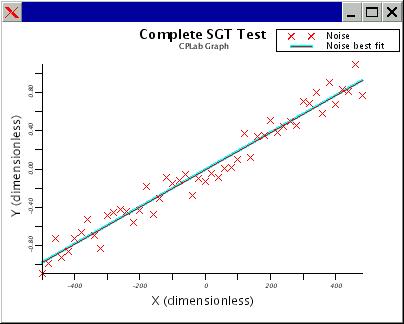
Once you have a DataSet its easy to get its best fit curve. If you have a SimpleGraph, sg, and a DataSet, ds, to plot the best fit curve of the DataSet use the following:
sg.addData(ds.getBestFitLine(), "Best Fit");
Explanation: ds.getBestFitLine() returns a new FitDataSet object (a DataSet object with extra functionality) that consists of 2 appropriate points and the HIGHLIGHT line style and sg.addData(..) plots it.
You can access the gradient and y axis intercept information by using the methods getGradient() and getIntercept(). An example follows:
FitDataSet f = d.getBestFitLine(); //where d is your original DataSet

System.out.println("The gradient of my best fit line is:"+f.getGradient());
System.out.println("The y axis intercept is: "+f.getIntercept());
Here is an example of a getBestFitLine plot:
There are methods for setting the legend text after it has already been assigned, changing the style of your DataSet and various other tricks, like hiding the graph. You can find these in the Javadocs for the SimpleGraph and DataSet classes (here). Methods related to customising a DataSet (or even the line it will produce) are located in DataSet and methods related to the graph window itself are found in SimpleGraph.
Note: When you reassign any of the legend text or change the properties of a DataSet, it will only be updated on the screen during the next call to
addData(...)
Clearing the SimpleGraph window:
You can clear the SimpleGraph of all current DataSets by using the method your_SimpleGraph.clear(). You may then add further DataSets after this as normal.
If you preferred to add x and y arrays of coordinates you can so like this:
        //Initialize 2 double arrays of length 100:
	double[] xArray = new double[100];
	double[] yArray = new double[100];

        //Assign x and x*x to the double arrays:
        for (double x = 0; x < 100; x++) {
           xArray[(int)x] = x;
           yArray[(int)x] = x * x;
        }

        //Call the special cplab method, passing the double arrays
        //we created from above:

        //Create an instance of SimpleGraph:
        SimpleGraph d = new SimpleGraph("X v. Y Demo", "x", "y");
        d.addData(xArray, yArray); //add the data we generated

	d.showGraph(); //you need to make window visible
Alternatively you can construct the graph and give it data all in the one method as follows:
        //...

	SimpleGraph sg = new SimpleGraph("X v. Y Demo",
                                        "x", "units", xArray,
				        "y", "units", yArray);

        sg.showGraph();

        //...
The parameters of this Simplegraph constructor are as follows (in left to right order):
Once you've created your SimpleGraph object, you can add further sets of data (without changing the titles and legends) quite simply with the following method:
d.addData(new_x_array, n_y_array); //arrays of doubles!
The axis will automatically rescale to fit all the datasets that
are present in the graph.
Once your graph is displayed in a window there are many controls for changing the appearance of your graph.
To zoom in, hold the left button mouse down and draw a square around the region you would like to zoom into and release the left button. The axis will rescale and the graph(s) will be redrawn.
To zoom out, Hold the CTRL button on the keyboard and click the left mouse button anywhere within the graph's window.
To change the appearance of a legend text, left click to select it and then right click on it and a dialog will appear with two tabs, Text and Position. In the text tab there are options for changing the colour, size and font of the text and the legend text itself. In the Position tab you can change the position of the text.
To change the appearance of an axis, left click on it follwed by a right click and a dialog will appear. On the Label tab you can change interval between the values displayed (Interval), the number of significant figures displayed (Sig Digits) and the colour, font and position of values. On the Range tab you can alter the range of values being displayed (the zoom). On the Tics/Style tab you can change the number of tics and which side of the axis they appear.
To change the appearance of the title, select it and then
right click to access its properties dialog. On the Text tab you can
alter its font, colour and size (HeightP). On the Position tab you can
position the text to your desired location. NOTE: You can also drag
the title text by holding the left button down, moving it and
releasing the left mouse button.
To print your graph, type xtoxv at the shell
prompt. You will be asked for a file name and then to click on a
window to grab. When your graph appears in an image window, right
click and press print on the middle right hand side of the dialog.
There exist alternative constructors for creating a SimpleGraph object by loading predefined datasets from text files of a particular format.
You can create a SimpleGraph object like this:
      SimpleGraph d = new SimpleGraph("Sine Wave Dataset Demo",
				      "Angle", "Degrees",
				      "Amplitude", "Displacement",
				      "sine_wave.txt");
You can examine the sine datafile used here and an example source here.
Note: The format of the dataset text file must be two columns of space separated numbers (with or without decimal places). A blank line represents the end of a dataset and is used for further methods for loading multiple datasets from the same file. Blank lines at the end of a file are ignored.
For your interest, this dataset was generated with the following program,
public class generateSineData {
    public static void main(String[] args) {
	for (double x = -500f ; x < 500f ; x += 0.1f) {
	    prt(x, Math.sin(Math.toRadians(x)));
	}
    }
    public static void prt(double x, double y){
	System.out.println("" + x + " " + y);
    }
}
This is how the above example should look:
To add a dataset from a file to a SimpleGraph object:
You can use the method below to add another dataset to a SimpleGraph (no matter how it was constructed).
d.addData("dataset2.txt", "My Data");
You can also use d.addData("dataset2.txt"), which will
automatically assign it the name, "DATA FILE", in the key pane.
One way to use the method described in the previous section might be to create a command line graph display program for quickly viewing datasets graphically. The code you would put in the main() method body might be something like:
        //...
	if (args.length < 6) {
	    System.out.println("Usage:\n\tgraph title xlegend"+
			       " xunits ylegend yunits datafile");
	}
	else {
	    SimpleGraph d = new SimpleGraph(args[0],args[1],args[2],
					    args[3],args[4],args[5]);
	}
        //...
It simply determines whether enough parameters have been given at the command line and then creates a SimpleGraph object with them. Beware however, this example does not enforce much error checking!
You can download the source file for this program
here.
For queries about this page contact the author Andrew Ellis